
3 March 2026
SUMMARY
➤ Markets jolted by US–Israel strikes on Iran and Iran’s retaliation. Over the weekend, acoordinated US–Israel strike reportedly killed Iran’s Supreme Leader Ayatollah Ali Khamenei andsenior security figures. Iran retaliated at Israel and US‑linked bases in Bahrain, Qatar, Kuwaitand the UAE, thereby raising geopolitical risk premia.
➤ Strait of Hormuz chokepoint disruption is the pain-point to supply chains. Major liners pausedtransits, insurers raised premiums, and multiple tankers were attacked, resulting in de factoshutdown through the corridor that handles about 20% of global petroleum liquid consumption. Brent and WTI rose 8-10% intraday
➤ Conflict timelines and political will. Washington signalled operations could take “weeks,” butwith upcoming November midterm election, rising cost of living, and voters war fatigue, theconflict could potentially result in lower voter turnout and derail Republican control of the Congress.
➤ Global energy system is more resilient than in past cycles: This is supported by strong US production, OPEC+ spare capacity and alternative routing infrastructure that could absorb temporary energy disruption shocks.
➤ As a trade dependent economy but net energy exporter, Malaysia faces a double-edged effect. Higher Brent supports PETRONAS-linked revenues and the fiscal backdrop; however, imported inflation and shipping/insurance frictions can pressure margins in E&E and consumer-facing sectors if Hormuz disruption lingers.
- US–Israel campaign against Iran has escalated from a targeted strike phase into a broader, highly disruptive regional confrontation. Multiple reputable news outlets reported that the opening US–Israel airstrike waves struck command nodes and senior leadership in Tehran, with Iran’s Supreme Leader Ayatollah Ali Khamenei & family reported killed, alongside several other senior officials including the army chief, defence minister, Iranian Revolutionary Guard top commander and a top security advisor to Khamenei. The attack triggered immediate Iranian missile and drone retaliation across the Gulf and at Israel.
- Retaliation by Iranian Revolutionary Guard Corps (‘IRGC’) warnings and attacks around key maritime corridor like Strait of Hormuz, has led major carriers to suspend or reroute voyages, creating a de facto shipping standstill through a corridor that normally handles about 30% of global seaborne oil trade and 20% of global liquified natural gas (LNG) trade.
- The campaign widened beyond Iran–Israel to involve Gulf monarchies hosting US facilities, with strikes and interceptions across Bahrain, Qatar, Kuwait and the UAE. US political line has been firm with President Trump signalling operations could continue for weeks, and senior officials have warned that US’ “hardest hits” may still be ahead despite Defence Secretary Pete Hegseth reported said that the US won’t get embroiled in another “endless war”.
- Meanwhile, China called for restraint and a ceasefire while reiterating respect for Iranian sovereignty, signalling diplomatic pressure for de‑escalation even as combat operations persist. On the policy side, former Treasury Secretary Janet Yellen warned that a fresh oil‑led inflation pulse could keep the Federal Reserve more cautious on rate cuts.
STRAIT OF HORMUZ AND ENERGY MARKETS – WHY IT MATTERS
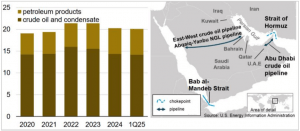
- The Strait of Hormuz closure is the critical chokepoint for global energy security. It is the only route to the open ocean for the Gulf-based exporters and handles about one-third of global LNG. The Energy Internation Agency (EIA) estimated 84% of crude oil and condensate shipments transiting the strait headed to Asian markets.
- Recent retaliation and attacks on vessels, have prompted many shipowners to pause transits, reroute, and slowing traffic to a standstill with more than 200 vessels anchored around the Strait. Notable casualty incidents include Marshall Islands-flagged tanker Skylight and India-flagged MKD Vyom off Muscat.
- There are factors however, that could limit how far and how long any crude oil spike last should the conflict eased. These include strong US oil production, spare capacity within OPEC+, and Saudi Arabia’s East-West pipeline, which can move crude to the Red Sea and bypass Hormuz, providing some relief to global supply.
Figure 1: Volume of petroleum transported through Strait of Hormuz and Alternative Routes (Source: EIA)
- Oil prices surged toward US$80/bbl as the Middle East conflict spreads and disrupted the flow of cargo and energy. Brent Crude Oil prices surged towards US$80/bbl as the Middle East conflict spreads and disrupted the flow of cargo and energy. The combination of halted or delayed Hormuz transits, temporary closures at Gulf financial markets, and interruptions at major Saudi energy assets tightened near-term supply and pushed a “war premium” into crude.
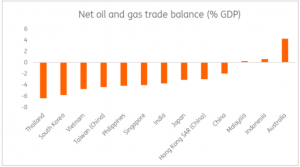
- Asia will feel the biggest impact from any disruption in Middle East oil supply as it buys two-thirds of its crude from the Gulf, with half of top global importer China’s supply and 90% of Japan’s coming from the region. Thailand, India, Korea and the Philippines are also vulnerable to the crude oil price volatility due to their high import dependence, while Malaysia would relatively benefit since it is a net energy exporter country.
Table 1: Expected impact of the oil disruption on Asia
| COUNTRY | KEY DEPENDENCY | PRIMARY SHOCK CHANNEL(S) | MITIGATING FACTOR | RISK IMPACT | WHY IT MATTERS |
|---|---|---|---|---|---|
| Malaysia | Relative beneficiary as net energy exporter | Higher oil prices can improve terms of trade / export receipt | Net exporter status | Low | Malaysia is comparatively insulated on the macro side and may benefit from higher energy prices versus importing peers. |
| India | >50% LNG imports Gulflinked; ~60% oil imports from Middle East | Dual shock: crude spike lifts oil import bill + LNG contract prices; “physical demand and financial shock”; blockade amplifies current-account pressures | None as the country is the net energy importer | Very High | India has the largest combined oil & LNG linkage to the Gulf; a Hormuz-driven spike hits both the energy bill and external balance simultaneously. |
| China | Purchases >80% of Iranian oil; ~30% LNG imports from Qatar/UAE; ~40% oil imports pass through Strait of Hormuz | Energy security risk; prolonged outage thereby intensifies price competition across Asia | LNG inventories 7.6 mil tons (endFeb) provide short-term cover | High | China has large throughput exposure to the Strait, but inventories provide short-term cover; prolonged disruption shifts stress into regional LNG bidding/competition |
| Japan | ~90% crude from region; limited LNG inventory; ~4.4 mil tons LNG (2–4 weeks cover) | Acute energy shortage risk; LNG supply tightness + price spikes | Inventory covers 2–4 weeks | Very High | High dependence + thin LNG buffer makes Japan acutely sensitive; beyond a few weeks, replacement cargoes likely come at sharply higher prices. |
| Korea | Vulnerable to crude volatility (high import dependence); limited LNG inventory; ~3.5 mil tons LNG (2–4 weeks cover) | LNG and oil price shock; near-term supply stress | Inventory covers 2–4 weeks | Very High | Korea’s limited LNG cover makes it highly exposed if disruption persists; forced spot procurement can amplify domestic energy costs |
| Thailand | Vulnerable to crude volatility (high import dependence); Reserves: 4.9 bn litres crude & refined which could last 38 days; 2.9 bn litres enroute reserves 23 days; total 61 days of reserves to meet domestic demand | Oil supply shock / price volatility; potential domestic fuel stress | 61-day total cover (in-country + enroute | High | Thailand is acutely exposed but has meaningful physical buffers; market risk remains via price volatility even if reserves are available. |
| Philippines | 100% crude imports from Middle East; 30-day stock reserves | Oil supply shock and price spike; high vulnerability | 30-day reserves | Very High | The Philippines is structurally the most exposed on crude sourcing; limited reserves mean disruption quickly becomes a policy issue. |
Figure 2: Oil and gas prices surged while the dollar and safe-heaven gold rallied (Source: Bloomberg)
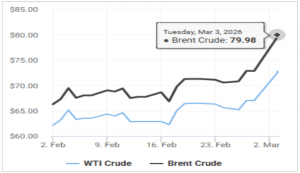
Figure 3: Major regional economies are net oil importers, exposing them to worsening trade balances when oil prices rise (Source: ING)
FREIGHT SPIKES, AND CORPORATE MARGIN RISK
- Freight rates and war-risk costs surged as carriers avoid the Strait and reroute logistics. This has triggered emergency freight increases and surcharges on Gulf-linked lanes (i.e. Maersk’s EFR of US$1,800/TEU for 20’ and US$3,000/FEU effective 2 Mar’26) and pushed operators to detour via the Cape of Good Hope, adding sailing days, fuel, and charter costs.
- Forward traders further warn of schedule volatility and tight capacity across both ocean and air networks as regional airspace curbs and port interruptions compound logistics crunch.
- Higher ocean rates and war‑risk premiums spillovers into land transport costs. Rising freight rates, insurance premiums, and extended transit times are inflating landed forwarding costs thereby tightening working capital margins for import-reliant sectors
- Manufacturers face production input‑cost creep (raw materials, components), while exporters contend with equipment shortages and longer lead times raising which could potentially delay revenue recognition and increasing inventory build-ups.
IMPACT ON MALAYSIA
- For Malaysia, the shock is two-sided. Higher oil prices support fiscal receipts and PETRONAS-linked cash flows, yet imported inflation (food and intermediate goods), higher shipping/insurance costs, and potential order delays pose headwinds to trade exposed sectors.
- Domestic demand still anchors growth, but downside risks rise should Hormuz disruption prolonged as freight costs remain elevated. On policy, BNM baseline is for the OPR to remain on-hold in near term, with vigilance on any oil related CPI shock and MYR stability.
- Bursa Malaysia tracked the global risk‑off move following the US–Iran escalation, with energy‑linked counters and defensives relatively firmer, while aviation/travel and cyclicals underperformed on higher fuel costs and demand uncertainty.
- While Malaysia does not rely on Hormuz for domestic cabotage, the closure of the Strait tightens supply chains and raises insurance/transport costs, which can delay shipments and pressure margins for exporters. Firms with Middle East exposure are likely to re‑route through safer nodes and extend lead times.
CAPITAL MARKET OUTLOOK & OPUS BOND MARKET VIEWS
- We expect US Treasuries yield to be biased upside, as markets weigh-in potential inflation risk from higher crude oil price. The 10Y US Treasury yield rose 8 bps above 4.0% and 2Y Treasury yields climbed to 10 bps at 3.479%, reflecting market view of pushing further out the Fed Fund rate cuts.
- Near‑term direction hinges on the duration of Strait of Hormuz energy supply disruption and Fed communication. A quick normalization of shipping risks would ease the inflation shock and support the long end, while prolonged disruptions would keep the front end of the yield curve under pressure as market reprices the Fed policy easing.
- USD strengthened on safe haven demand as USD/MYR surged above 3.90 with markets reassessing the conflict’s duration. Despite the Ringgit tend to benefit from higher crude oil price, broad US dollar tends to outperform during risk-off events.
- Gold retains a strong safe‑haven bid amid Middle East tensions and shipping risks. Gold prices rose 2% and traded at their highest level in one month. Gold briefly reclaimed $5,400 an ounce before giving up the gains. Protracted geopolitical tensions and slower than expected disinflation path could keep gold supported near recent highs in the near term.
- FBM KLCI marginally fell by 0.95% to close at 1,700.21 on 2 Mar’26 (intraday low: 1,684), tracking broader regional weakness on energy price surged and risk-aversion.
- Domestic bond market is expected to exhibit resiliency, underpinned by narrowing yield differentials between the US and Emerging Markets as well as continuing institutional support. Ringgit’s dynamics are expected to remain healthy, with support from foreign direct flows, multi-year AI and data centres investment, fiscal consolidation commitments and undemanding local equity valuations.
Disclaimer
The information, analysis and opinions expressed herein are for general information only and are not intended to provide specific advice or recommendations for any individual entity. Individual investors should contact their own licensed financial professional advisor to determine the most appropriate investment options. This material contains the opinions of the manager, based on assumptions or market conditions and such opinions are subject to change without notice. This material has been distributed for informational purposes only and should not be considered as investment advice or a recommendation of any particular security, strategy or investment product. Information provided herein may include data or opinion that has been obtained from, or is based on, sources believed to be reliable, but is not guaranteed as to the accuracy or completeness of the information. No part of this material may be reproduced in any form, or referred to in any other publication, without express written permission. Opus Asset Management Sdn Bhd and its employees accept no liability whatsoever with respect to the use of this material or its contents.